How to Debug a BSOD in Vista
You might have been directed to Vox's BSOD troubleshooting via Vistax64 forums but STOP errors are caused by 4 key problems:
1. New hardware physically installed that is causing problems or its drivers are causing problems.
2. New software installed that is causing problems or its drivers/services may be causing Vista to STOP.
3. A virus infection could also be causing Vista to fall over.
4. Any system changes via the registry or services control panel that a user might have made or changes that could be made via the first 3 steps.
In essence, those are the roots of STOP errors, and most of them are related to poorly written drivers. So if you are getting any STOP errors, consult the above list, and if any of the steps stands out as a problem.
Debugging STOP errors is not too difficult. To begin, download the latest version - www.microsoft.com/whdc/devtools/debugging/.
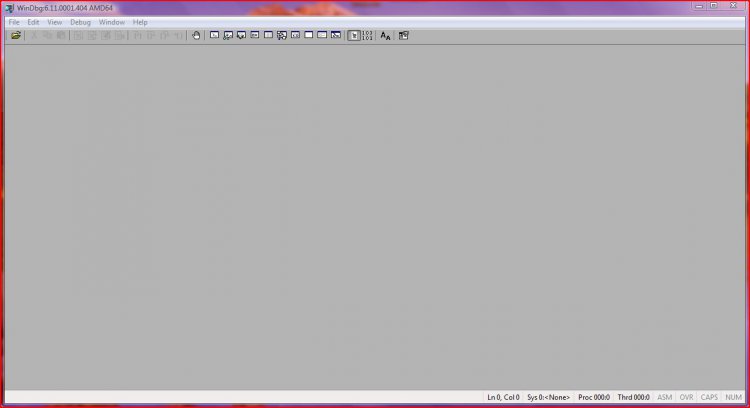
Make sure you choose the right architecture for your system, whether x86 for 32-bit or x64 for 64-bit. Download and install the tool. It's a good idea to frequently check the website for new versions of the tool. Once installed you'll see this:
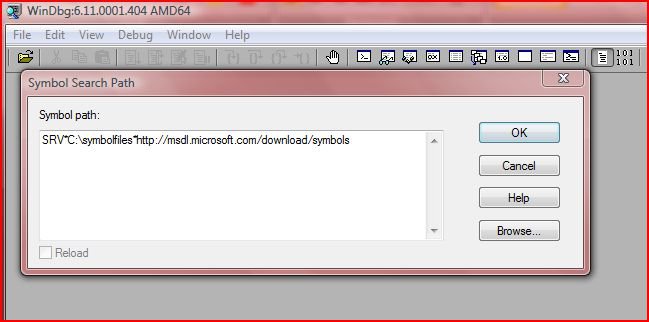
This is WinDbg running on an x64 system. The first thing you need to do is configure the symbol path, so open up File - Symbol File Path and enter the text you see in the following diagram:
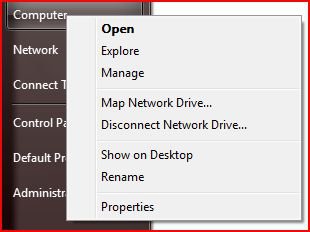
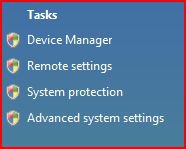
You need an internet connection now, as WinDbg needs to download symbols to read any dump file you may import. Locate a .dmp file and then go to File - Open Crash Dump to locate a .dmp for analysis. Open it and wait for the symbols to download. While you are waiting now is a good time to adjust (as necessary) your dump settings. Open up system properties opening the start menu, right clicking Computer and selecting properties:
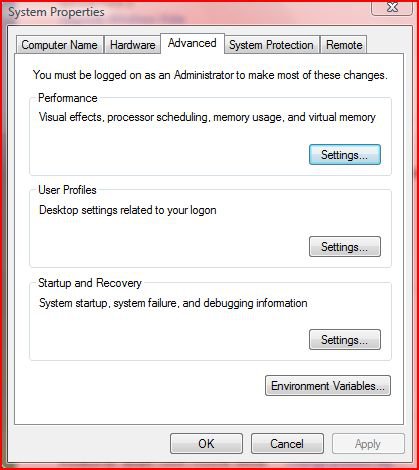
Accept the UAC prompt, which incidentally should always be turned on, and then select the settings part of Startup and Recovery:
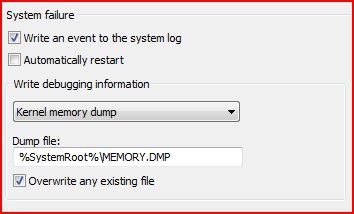
It's up to you whether your PC/laptop should restart about a STOP error but I prefer to clear the box. You can also choose to overwrite an existing file or not and what size the dump should be. The following are my settings. Choose the options you want:
As the symbols would have been downloaded by now, it's time to examine the results in more detail, so enter !analyze - vIf you can't open the .dmp file, close WinDbg, then right-click the shortcut and select run as administrator. It would also be good if you moved the dumps out of protected system locations to your user folder.
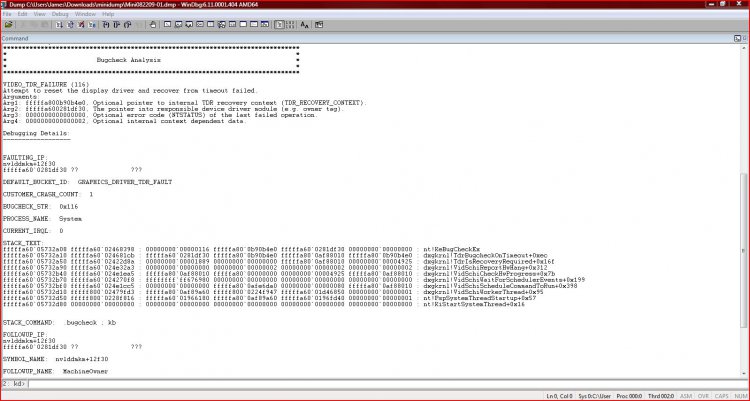
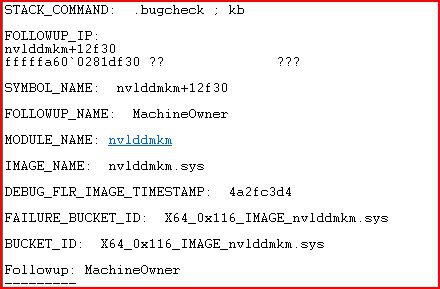
Once the symbols are downloaded, you don't need an internet connection. Check the C: drive for a symbolfiles folder. I've used an example .dmp file here. However, the same general steps apply, so use this as a template. This has a lot of detail regarding the crash as you can see from the following example in two screenshots:
Note for this example the symbol file couldn't be loaded for the FAULTING_IP field, but there is still plenty of information. Your dumps will vary. The first thing to see in the first screenshot:
is the VIDEO_TDR FAILURE just under BugCheck Analysis. The debugger lists that it was the result of a time out along with arguments. This is a starting point and the debugger is usually correct. Always look at the info before Debugging Details for reference. More info is displayed below.
The BUGCHECK_STR field shows the exception code - in this case its 0x116.
The DEFAULT_BUCKET_ID shows the category of the error. In this case, its a graphics driver.
The PROCESS_NAME shows the name of the process that raised the exception - in this case it was System.
The STACT_TEXT shows a stack trace. The trace shows a single function call in the memory of a call stack, which is a set of stack frames representing the function calls for each thread, if you wanted to know. A new function call means a new stack frame. When the function returns the stack frame is ejected from the stack. Note any recurring faults - in this case dxgkrnl.
The STACK_COMMAND shows the command used to obtain STACK_TEXT. You can alter the command or repeat the stack display.
The second screenshot shows a trace of the faulting component. The FAILURE_BUCKET_ID is more specific and points to a driver file, as shown by the IMAGE_NAME. It also references the BUGCHECK_STR.
This information points to a problem with nvidia drivers. The next step would be to google the IMAGE_NAME along with BSOD to see what solutions are available, i.e. nvlddmkm.sys BSOD. For this, I would first uninstall the driver via device manager, then reboot into safe mode and run drive sweeper by guru3d. Then I would install fresh drivers in safe mode and then try windows once again. More drivers might need to be updated and there might be a hotfix for the dxgkrnl that was at fault.As I've shown, debugging crash dump's isn't too difficult. However, I've barely scratched the surface and there is a lot more to know. I may be posting some advanced guides in the future, but this is enough to check your crash dumps and begin working on a solution. Post back any feedback at www.vistax64.com if you can.
v1.2
Related Tutorials
Attachments
Last edited by a moderator:

